3.Filebeat日志收集
孙富阳, 江湖人称没人称。多年互联网运维工作经验,曾负责过孙布斯大规模集群架构自动化运维管理工作。擅长Web集群架构与自动化运维,曾负责国内某大型博客网站运维工作。
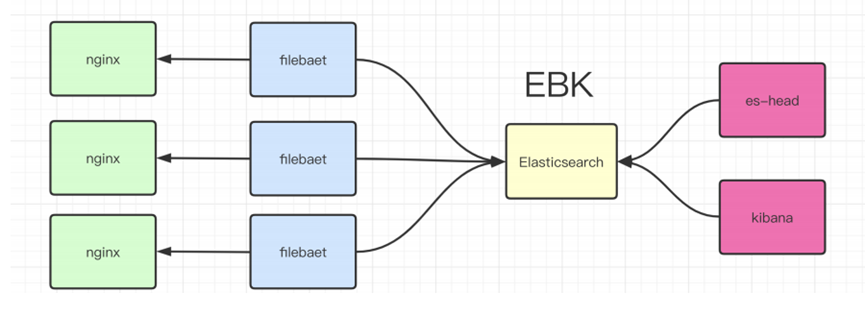
1.EBLK介绍
1.日志分析的需求
1.找出访问排名前十的IP,URL
2.找出10点到12点之间排名前十的IP,URL
3.对比昨天这个时间段访问情况有什么变化
4.对比上个星期同一天同一时间段的访问变化
5.找出搜索引擎访问的次数和每个搜索引擎各访问了多少次
6.指定域名的关键链接访问次数,响应时间
7.网站HTTP状态码情况
8.找出攻击者的IP地址,这个IP访问了什么页面,这个IP什么时候来的,什么时候走的,共访问了多少次
9.5分钟内告诉结果
2.EBLK的功能介绍
E   Elasticsearch java
B   Filebeat      Go
L   Logstash      java
K   Kibana        java
3.EBK日志收集流程
2.实验环境配置
1.Elasticsearch单节点安装部署
rpm -ivh elasticsearch-7.9.1-x86_64.rpm
cat > /etc/elasticsearch/elasticsearch.yml << 'EOF'
node.name: node-1
path.data: /var/lib/elasticsearch
path.logs: /var/log/elasticsearch
network.host: 127.0.0.1,10.0.0.51
http.port: 9200
discovery.seed_hosts: ["10.0.0.51"]
cluster.initial_master_nodes: ["10.0.0.51"]
EOF
systemctl daemon-reload
systemctl start elasticsearch.service
netstat -lntup|grep 9200
curl 127.0.0.1:9200
2.kibana安装部署
rpm -ivh kibana-7.9.1-x86_64.rpm
cat > /etc/kibana/kibana.yml << 'EOF'
server.port: 5601
server.host: "10.0.0.51"
elasticsearch.hosts: ["http://10.0.0.51:9200"]
kibana.index: ".kibana"
EOF
systemctl start kibana
3.Elasticsearch-head安装部署
google浏览器-->更多工具-->拓展程序-->开发者模式-->选择解压缩后的插件目录3.filebeat基本使用
1.filebeat从标准输入读取信息
###安装并配置
rpm -ivh filebeat-7.9.1-x86_64.rpm
cp /etc/filebeat/filebeat.yml /opt/
cat > /etc/filebeat/filebeat.yml << EOF
filebeat.inputs:
- type: stdin ###表示从输入中收取信息
  enabled: true
output.console: ###你要输出到哪里
  pretty: true
  enable: true
EOF
###启动并检查
filebeat -e -c /etc/filebeat/filebeat.yml
然后直接在当前终端输入abc,会发现自动添加了很多信息,包括节点名称等信息,这样收集的日志可以方便的查询是那个节点的日志。

2.filebeat收集message日志
###配置filebeat
[root@es-node3 ~]# cat /etc/filebeat/filebeat.yml
filebeat.inputs:
- type: log
paths:
- /var/log/messages
enabled: true
output.elasticsearch:
hosts: ["10.0.0.150:9200","10.0.0.151:9200","10.0.0.152:9200"]
###启动并检查
[root@es-node3 ~]# systemctl restart filebeat.service
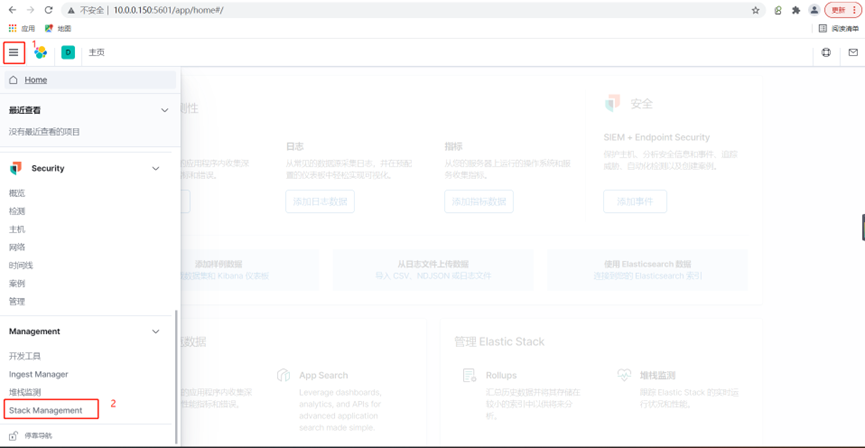
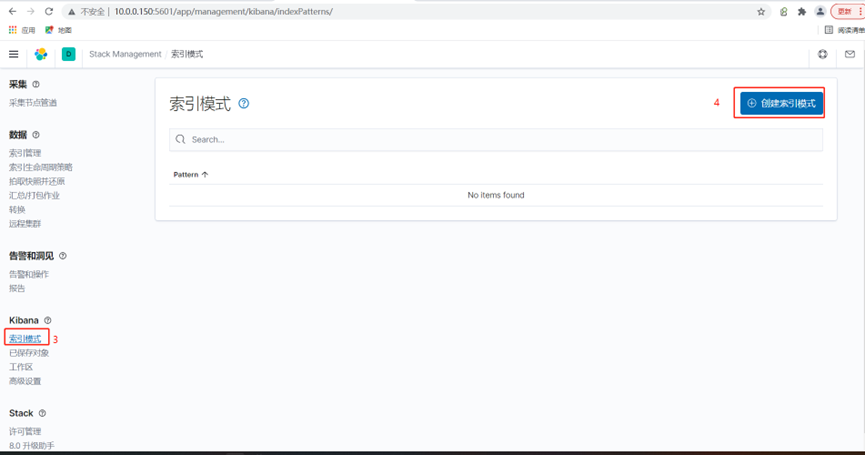
###登录kibina并依次点击下图所示位置
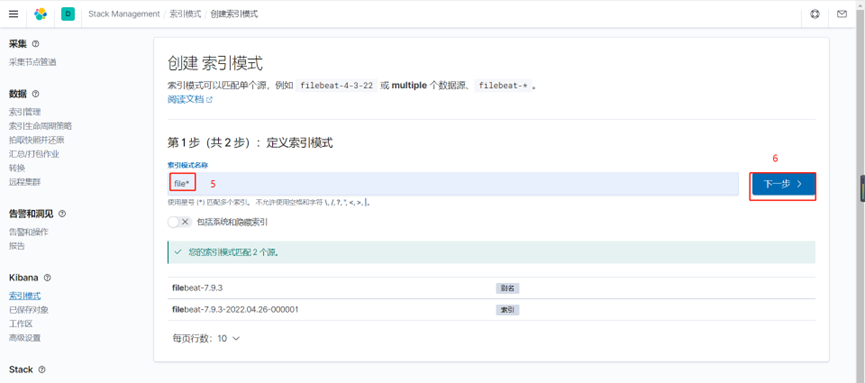
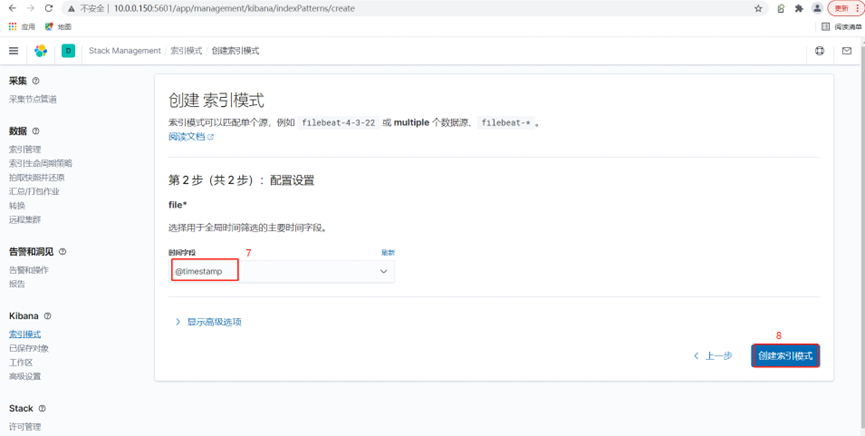
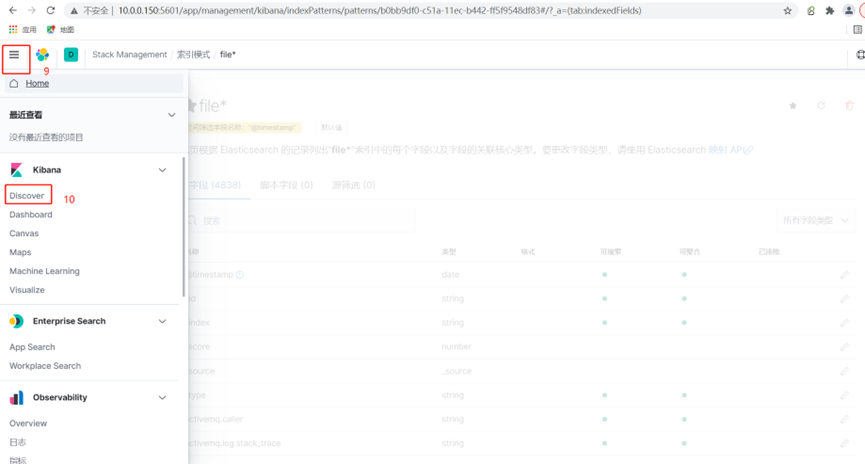

可以看到日志已经被展示过来了
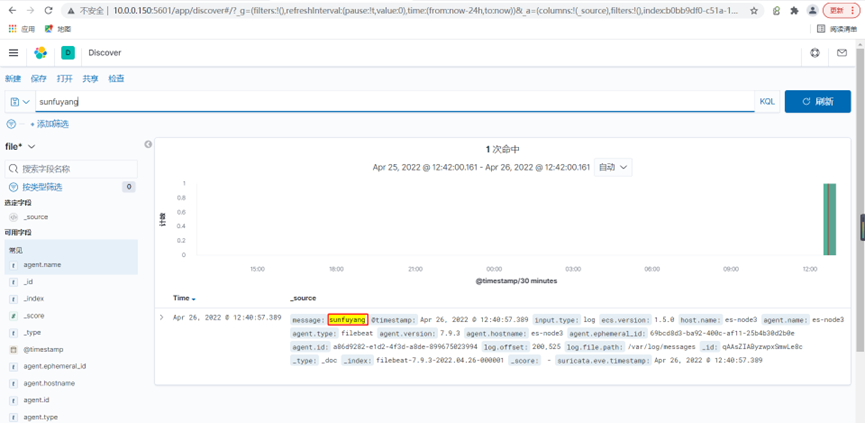
###往日志里输入点东西
[root@es-node3 ~]# echo sunfuyang >> /var/log/messages
点击刷新后,点击搜索,发现已经命中了
4.filebeat收集系统文件日志
1.配置所有系统日志打到sunfuyang.log里
[root@es-node3 ~]# yum install rsyslog -y
[root@es-node3 ~]# vim /etc/rsyslog.conf
# Provides UDP syslog reception
$ModLoad imudp
$UDPServerRun 514
*.*     /var/log/sunfuyang.log
[root@es-node3 ~]# systemctl restart rsyslog
###测试一下是否能打到sunfuyang.log里
[root@es-node3 ~]#  logger "rsyslog test from sunfuyang"
2.配置filebeat配置文件
[root@es-node3 ~]# cat /etc/filebeat/filebeat.yml
filebeat.inputs:
- type: log
  paths:
  - /var/log/sunfuyang.log
  enabled: true
output.elasticsearch:
  hosts: ["10.0.0.150:9200","10.0.0.151:9200","10.0.0.152:9200"]
[root@es-node3 ~]# systemctl restart filebeat.service
3.删除原来FIlebeat的索引;重新添加;
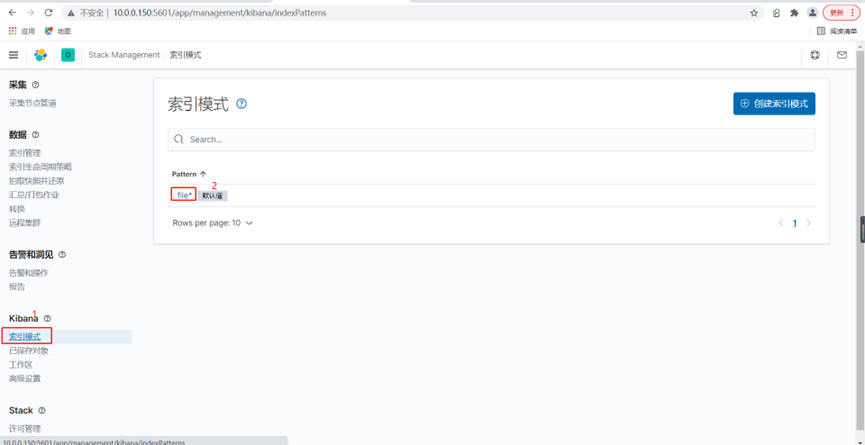
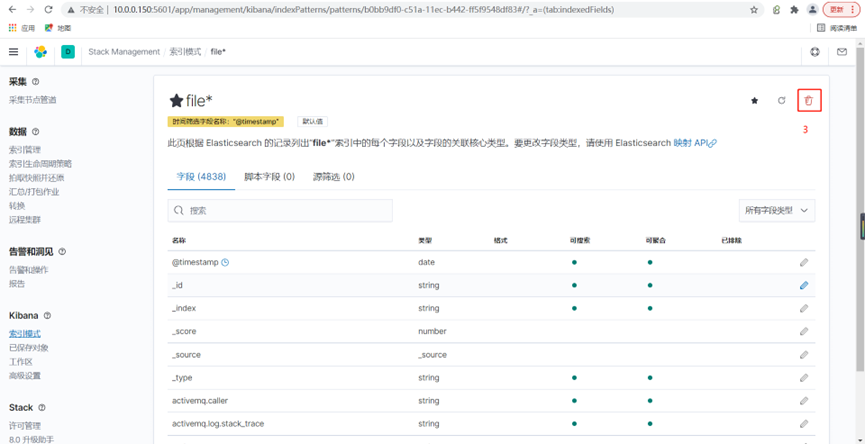
重新创建索引,如下图发现有很多filebeat的info信息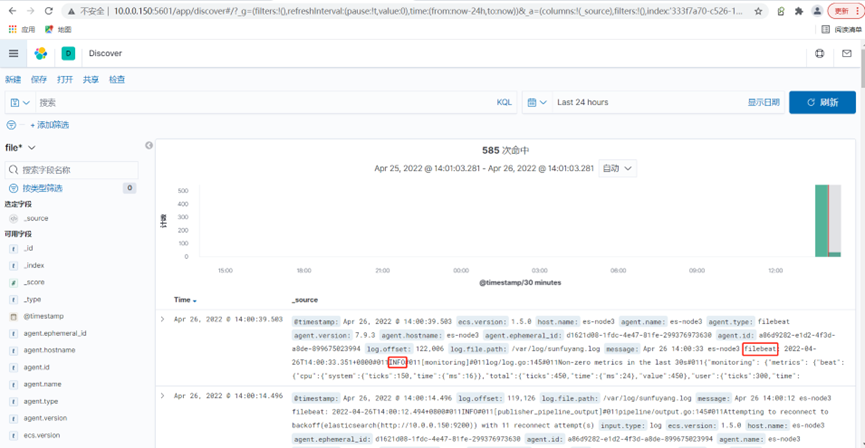
4.配置Filebeat过滤不需要的信息
###删除kibana匹配es索引的模式;	( 不能看数据,不代表索引被删除; )
###删除es的索引;		( 删除索引,数据页没了; )
###配置filebeat配置文件
[root@es-node3 ~]# cat /etc/filebeat/filebeat.yml
filebeat.inputs:
- type: log
  paths:
  - /var/log/sunfuyang.log
  enabled: true
  # 仅包含,错误信息,警告信息,sshd的相关配置,其他的都会过滤掉
  include_lines: ['^ERR', '^WARN', 'sshd']
output.elasticsearch:
  hosts: ["10.0.0.150:9200","10.0.0.151:9200","10.0.0.152:9200"]
[root@es-node3 ~]# systemctl restart filebeat
可以清晰的看到收集的日志量少了很多

5.配置Filebeat自定义索引名称
[root@es-node3 ~]# cat /etc/filebeat/filebeat.yml
filebeat.inputs:
- type: log
paths:
- /var/log/sunfuyang.log
enabled: true
# 仅包含,错误信息,警告信息,sshd的相关配置,其他的都会过滤掉
include_lines: ['^ERR', '^WARN', 'sshd']
output.elasticsearch:
hosts: ["10.0.0.150:9200","10.0.0.151:9200","10.0.0.152:9200"]
index: "system-%{[agent.version]}-%{+yyyy.MM.dd}"
setup.ilm.enabled: false ###如果不关闭的话,索引名称无法自定义
setup.template.name: "system" #定义模板名称
setup.template.pattern: "system-*" #定义模板的匹配索引名称
[root@es-node3 ~]# systemctl restart filebeat
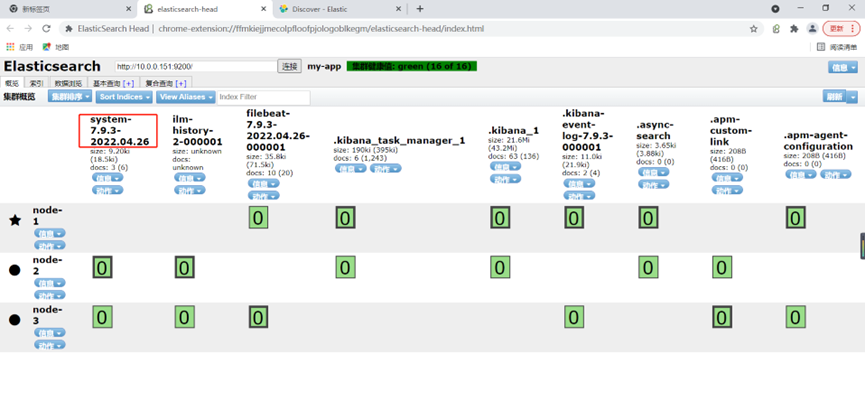
通过es的插件可以看到多了一个索引
6.配置Filebeat自定义分片数量
删除原先创建的模板
###修改filebeat配置文件
[root@es-node3 ~]# cat /etc/filebeat/filebeat.yml
filebeat.inputs:
- type: log
paths:
- /var/log/sunfuyang.log
enabled: true
# 仅包含,错误信息,警告信息,sshd的相关配置,其他的都会过滤掉
include_lines: ['^ERR', '^WARN', 'sshd']
output.elasticsearch:
hosts: ["10.0.0.150:9200","10.0.0.151:9200","10.0.0.152:9200"]
index: "system-%{[agent.version]}-%{+yyyy.MM.dd}"
setup.ilm.enabled: false ###如果不关闭的话,索引名称无法自定义
setup.template.name: "system" #定义模板名称
setup.template.pattern: "system-*" #定义模板的匹配索引名称
##setup.template.enabled: false###不使用模板
setup.template.settings:
index.number_of_shards: 3 ###定义模板分片数
index.number_of_replicas: 1 ##定义模板副本数
###删除索引,重启filebeat,产生新的数据
[root@es-node3 ~]# systemctl restart filebeat.service
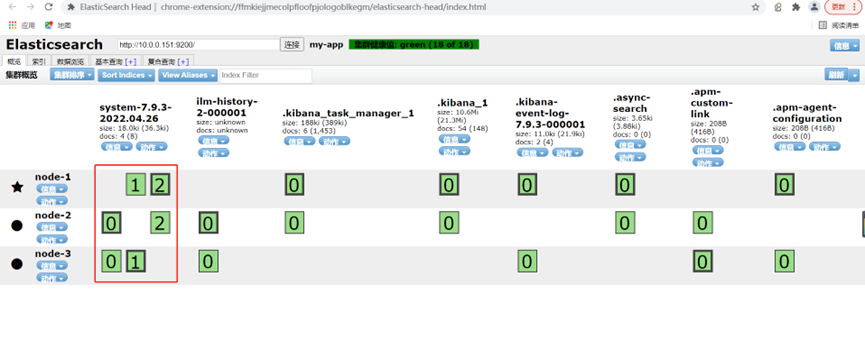
可以看到数据被分成了三个分片
如果先配置了自定义名称,后期无法修改,分片,因为模板固定分片为1;
解决方法: 删除模板,删除索引,然后重启filebeat,产生新的数据;
7.Filebeat收集多节点系统日志
###配置所有系统日志打到sunfuyang.log里
[root@es-node2 ~]# yum install rsyslog -y
[root@es-node2 ~]# vim /etc/rsyslog.conf
# Provides UDP syslog reception
$ModLoad imudp
$UDPServerRun 514
*.*     /var/log/sunfuyang.log
[root@es-node2 ~]# systemctl restart rsyslog
###测试一下是否能打到sunfuyang.log里
[root@es-node2 ~]#  logger "rsyslog test from sunfuyang"
###拷贝node3节点的filebeat配置文件到node2节点
[root@es-node2 ~]# scp -rp 10.0.0.152:/etc/filebeat/filebeat.yml /etc/filebeat/filebeat.yml
[root@es-node2 ~]# systemctl restart filebeat.service
添加字段后可以很清楚的看到数据是从那个机器来的


5.filebeat收集普通格式的nginx日志
1.安装配置nginx
cat > /etc/yum.repos.d/nginx.repo <<'EOF'
[nginx-stable]
name=nginx stable repo
baseurl=http://nginx.org/packages/centos/$releasever/$basearch/
gpgcheck=0
enabled=1
gpgkey=https://nginx.org/keys/nginx_signing.key
EOF
[root@es-node3 ~]# yum makecache
[root@es-node3 ~]# yum install nginx -y
[root@es-node3 ~]# cat /etc/nginx/conf.d/elk.conf
server {
      listen 80;
     server_name elk.sfy.com;
     root /code;

     location / {
          index index.html;
     }
}
[root@es-node3 ~]# systemctl start nginx
[root@es-node3 ~]# mkdir /code
[root@es-node3 ~]# echo node03 > /code/index.html
2.配置filebeat
[root@es-node3 ~]# cat /etc/filebeat/filebeat.yml
filebeat.inputs:
- type: log
  paths:
  - /var/log/nginx/access.log
  enabled: true

output.elasticsearch:
  hosts: ["10.0.0.150:9200","10.0.0.151:9200","10.0.0.152:9200"]
  index: "nginx-access-%{[agent.version]}-%{+yyyy.MM.dd}"

setup.ilm.enabled: false ###如果不关闭的话,索引名称无法自定义
setup.template.name: "nginx"       #定义模板名称
setup.template.pattern: "nginx-*"  #定义模板的匹配索引名称
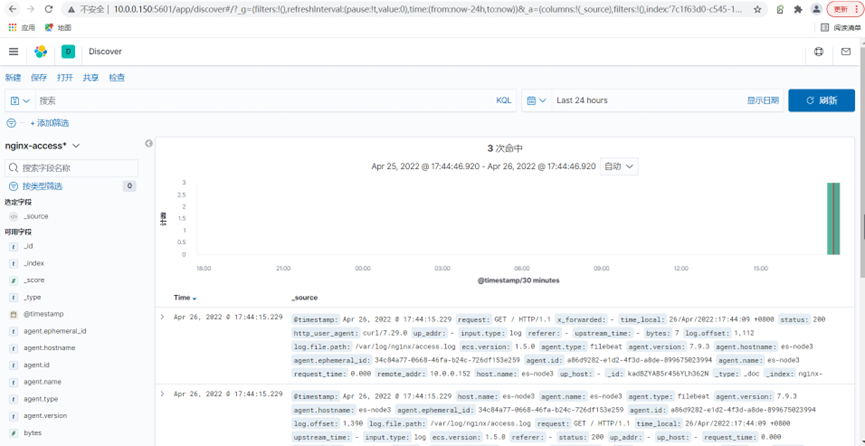
3.创建访问日志并登录kibina查看
[root@es-node3 ~]# curl -HHost:elk.sfy.com http://10.0.0.152
可以看到日志已经被收集上来了

4.即想收集nginx日志又想收集系统日志怎么办
[root@es-node3 ~]# filebeat -c /etc/filebeat/filebeat.yml --path.data /var/lib/filebeat
[root@es-node3 ~]# filebeat -c /etc/filebeat/system.yml --path.data /opt/mod/
###只需要指定不同的配置文件,不同的path.data即可
6.filebeat收集Json格式的Nginx日志
1.当前日志收集方案的不足
所有日志都存储在message的value里,不能拆分单独显示
要想单独显示,就得想办法把日志字段拆分开,变成json格式
2.我们期望的日志收集效果
可以把日志所有字段拆分出来
{
 "time_local": "24/Dec/2022:09:43:45 +0800",
 "remote_addr": "127.0.0.1",
 "referer": "-",
 "request": "HEAD / HTTP/1.1",
 "status": 200,
 "bytes": 0,
 "http_user_agent": "curl/7.29.0",
 "x_forwarded": "-",
 "up_addr": "-",
 "up_host": "-",
 "upstream_time": "-",
 "request_time": "0.000"
}
3.修改Nginx配置文件
log_format json '{ "time_local": "$time_local", '
                         '"remote_addr": "$remote_addr", '
                         '"referer": "$http_referer", '
                         '"request": "$request", '
                         '"status": $status, '
                         '"bytes": $body_bytes_sent, '
                         '"http_user_agent": "$http_user_agent", '
                         '"x_forwarded": "$http_x_forwarded_for", '
                         '"up_addr": "$upstream_addr",'
                         '"up_host": "$upstream_http_host",'
                         '"upstream_time": "$upstream_response_time",'
			 '"request_time": "$request_time"'
			' }';
access_log /var/log/nginx/access.log json;
4.清空旧的日志文件并重启nginx
> /var/log/nginx/access.log
nginx -t
systemctl restart nginx
curl 127.0.0.1
cat /var/log/nginx/access.log
5.修改filebeat配置文件并查看kibana
[root@es-node3 ~]# cat /etc/filebeat/filebeat.yml
filebeat.inputs:
- type: log
  paths:
  - /var/log/nginx/access.log
  enabled: true
  json.keys_under_root: true  ##这两行意思是开启支持json的key,#Flase会将json解析的格式存储至messages,改为true则不存储至message
  json.overwrite_keys: true  #覆盖默认message字段,使用自定义json格式的key

output.elasticsearch:
  hosts: ["10.0.0.150:9200","10.0.0.151:9200","10.0.0.152:9200"]
  index: "nginx-access-%{[agent.version]}-%{+yyyy.MM.dd}"

setup.ilm.enabled: false ###如果不关闭的话,索引名称无法自定义
setup.template.name: "nginx"       #定义模板名称
setup.template.pattern: "nginx-*"  #定义模板的匹配索引名称
7.filebeat同时收集nginx访问日志和错误日志
1.当前日志收集方案的不足
虽然日志可以拆分了,但是索引名称还是默认的,根据索引名称并不能看出来收集的是什么日志。2.我们期望的日志收集效果
nginx-access-7.9.1-2022.4
nginx-error-7.9.1-2022.4
3.修改filebeat配置文件
[root@es-node3 ~]# cat /etc/filebeat/filebeat.yml
filebeat.inputs:
- type: log
  paths:
  - /var/log/nginx/access.log
  enabled: true
  tags: nginx-access ###打个标签
  json.keys_under_root: true ##这两行意思是开启支持json的key
  json.overwrite_keys: true

- type: log
  paths:
  - /var/log/nginx/error.log
  enabled: true
  tags: nginx-error ###打个标签

output.elasticsearch:
  hosts: ["10.0.0.150:9200","10.0.0.151:9200","10.0.0.152:9200"]
  indices:
  - index: "nginx-access-%{[agent.version]}-%{+yyyy.MM.dd}"
    when.contains:
      tags: "nginx-access" ###匹配到这个标签,打到es这个索引
  - index: "nginx-error-%{[agent.version]}-%{+yyyy.MM.dd}"
    when.contains:
      tags: "nginx-error" ###匹配到这个标签,打到es这个索引

setup.ilm.enabled: false ###如果不关闭的话,索引名称无法自定义
setup.template.name: "nginx"       #定义模板名称
setup.template.pattern: "nginx-*"  #定义模板的匹配索引名称
4.创造访问日志并检查收集结果
可以看到索引已经创建出来了
5.nginx多虚拟主机的日志收集
同上打个标签就行了
blog ---> /var/log/nginx/blog.sfy.com.log
edu ---> /var/log/nginx/edu.sfy.com.log
###nginx配置文件
[root@web01 conf.d]# cat edu.sfy.com.conf
server {
	listen 80;
	server_name edu.sfy.com;
	root /code/edu;
	access_log /var/log/nginx/edu.log json;

	location / {
		index index.html;
	}

[root@web01 conf.d]# cat blog.sfy.com.conf
server {
	listen 80;
	server_name blog.sfy.com;
	root /code/blog;
	access_log /var/log/nginx/blog.log json;

	location / {
		index index.html;
	}
}
###创建站点目录并访问数据
mkdir /code/blog
echo "blog.." > /code/blog/index.html
mkdir /code/edu
echo "edu.." > /code/edu/index.html
systemctl reload nginx
curl -HHost:edu.sfy.com http://10.0.0.7
curl -HHost:blog.sfy.com http://10.0.0.7
###filebeat配置文件
[root@web01 conf.d]# cat /etc/filebeat/filebeat.yml
filebeat.inputs:
- type: log
  enabled: true
  paths:
    - /var/log/nginx/access.log
  json.keys_under_root: true  #Flase会将json解析的格式存储至messages,改为true则不存储至message
  json.overwrite_keys: true   #覆盖默认message字段,使用自定义json格式的key
  tags: nginx-access

- type: log
  enabled: true
  paths:
    - /var/log/nginx/blog.log
  json.keys_under_root: true  #Flase会将json解析的格式存储至messages,改为true则不存储至message
  json.overwrite_keys: true   #覆盖默认message字段,使用自定义json格式的key
  tags: nginx-blog

- type: log
  enabled: true
  paths:
    - /var/log/nginx/edu.log
  json.keys_under_root: true  #Flase会将json解析的格式存储至messages,改为true则不存储至message
  json.overwrite_keys: true   #覆盖默认message字段,使用自定义json格式的key
  tags: nginx-edu

- type: log
  enabled: true
  paths:
    - /var/log/nginx/error.log
  tags: nginx-error


output.elasticsearch:
  hosts: ["10.0.0.151:9200","10.0.0.152:9200","10.0.0.150:9200"]
  indices:
    - index: "nginx-access-%{[agent.version]}-%{+yyyy.MM.dd}"
      when.contains:
        tags: "nginx-access"  #tags为access的日志存储至nginx-access-* 索引
    - index: "nginx-blog-%{[agent.version]}-%{+yyyy.MM.dd}"
      when.contains:
        tags: "nginx-blog"   #tags为error的日志存储至nginx-error-* 索引
    - index: "nginx-edu-%{[agent.version]}-%{+yyyy.MM.dd}"
      when.contains:
        tags: "nginx-edu"   #tags为error的日志存储至nginx-error-* 索引
    - index: "nginx-error-%{[agent.version]}-%{+yyyy.MM.dd}"
      when.contains:
        tags: "nginx-error"   #tags为error的日志存储至nginx-error-* 索引


setup.ilm.enabled: false
setup.template.name: "nginx"       #定义模板名称
setup.template.pattern: "nginx-*"  #定义模板的匹配索引名称
8.filebeat收集tomcat日志
1.修改tomcat访问日志格式为json
<Host name="elk.tomcat.com" appBase="webapps"
unpackWARs="true" autoDeploy="true">
<Valve className="org.apache.catalina.valves.AccessLogValve" directory="logs"
prefix="elk.tomcat_access_log" suffix=".txt"
pattern="{"clientip":"%h","ClientUser":"%l","authenticated":"%u","AccessTime":"%t","method":"%r","status":"%s","SendBytes":"%b","Query?string":"%q","partner":"%{Referer}i","AgentVersion":"%{User-Agent}i"}" />
2.配置filebeat收集访问日志和错误日志
访问日志修改格式为json即可,错误日志可能会有多行,需要将多行匹配为一行
建议阅读:
https://www.elastic.co/guide/en/beats/filebeat/current/multiline-examples.html
[root@web01 filebeat]# cat /etc/filebeat/filebeat.yml
filebeat.inputs:
- type: log
  enabled: true
  paths:
    - /soft/tomcat/logs/elk.tomcat_access_log.*.txt
  json.keys_under_root: true  #Flase会将json解析的格式存储至messages,改为true则不存储至message
  json.overwrite_keys: true   #覆盖默认message字段,使用自定义json格式的key
  tags: tomcat-access

- type: log
  enabled: true
  paths:
    - /soft/tomcat/logs/catalina.out
  tags: tomcat-error
  multiline.pattern: '^\d{2}' ###\d匹配数字
  multiline.negate: true
  multiline.match: after
  multiline.max_lines: 1000 ###修改最大匹配行数


output.elasticsearch:
  hosts: ["10.0.0.161:9200","10.0.0.162:9200","10.0.0.163:9200"]
  indices:
    - index: "tomcat-access-%{[agent.version]}-%{+yyyy.MM.dd}"
      when.contains:
        tags: "tomcat-access"  #tags为access的日志存储至nginx-access-* 索引
    - index: "tomcat-error-%{[agent.version]}-%{+yyyy.MM.dd}"
      when.contains:
        tags: "tomcat-error"

setup.ilm.enabled: false
setup.template.name: "tomcat"       #定义模板名称
setup.template.pattern: "tomcat-*"  #定义模板的匹配索引名称
未经允许不得转载:孙某某的运维之路 » 3.Filebeat日志收集

评论已关闭